In December, I migrated all of my home lab clusters from NGINX Ingress to Envoy Gateway. I wrote about the process in Modernizing the Gateway, covering the phased rollout, the HTTPRoute conversions, and the cleanup of years of Traefik and NGINX configuration.
Three months later, the most honest thing I can say about the migration is this: I forgot it happened.
No incidents. No late-night debugging sessions. No "why is this service unreachable" Slack messages to myself. The traffic flows, TLS terminates, and routes resolve. Envoy Gateway has been completely invisible — and if you've ever operated a reverse proxy, you know that invisible is the highest compliment you can pay one.
The Clock Ran Out
This month — March 2026 — NGINX Ingress Controller is officially retired. No more releases, no security patches, no bug fixes. The Kubernetes SIG Network announcement from November 2024 made the recommendation clear: migrate to the Gateway API.
If you're still running NGINX Ingress, you're now running unsupported software in your ingress path. That's the component handling every request into your cluster. It's not the place to carry technical debt.
I got ahead of the deadline by about three months. Not because I'm unusually disciplined — I just happened to be in the middle of a network rebuild and the timing lined up. But even if it hadn't, the migration turned out to be straightforward enough that I'd have been comfortable doing it under pressure.
Why This Migration Was Boring (In the Best Way)
Not every migration I've written about on this blog has gone smoothly. I've had my share of "what do you mean the cluster won't come back up" moments. So what made this one different?
The ecosystem was ready. Most of the Helm charts I use already supported Gateway API resources natively. I wasn't hand-rolling HTTPRoute manifests from scratch or writing custom templates — the charts had gateway configuration sections waiting to be enabled. When the tooling meets you where you are, migrations shrink from projects to tasks.
The Gateway API is genuinely better. HTTPRoute is more expressive than Ingress. The explicit parentRefs model makes it immediately clear which gateway handles which route. No more guessing which ingress class annotation you need, or whether the controller will actually pick up your resource. The separation between infrastructure operators (who manage Gateways) and application developers (who manage Routes) maps cleanly to how I think about my own deployments, even as a team of one.
Envoy is battle-tested. Envoy Gateway is the new part, but Envoy proxy has been handling production traffic at massive scale for years. I wasn't betting on an unproven proxy — I was adopting a new management layer for a proven one. The EnvoyProxy custom resource gives real control over proxy behavior without the annotation soup that NGINX Ingress required.
What I'm Not Using
Honesty requires mentioning the features I haven't touched. Envoy Gateway supports traffic splitting, request mirroring, and multi-cluster routing. I'm not using any of them.
Multi-cluster traffic management is handled by Linkerd's multicluster extension in my setup, and it works well. I didn't migrate to Envoy Gateway to replace that — I migrated because my ingress controller was being retired and the Gateway API is the clear path forward.
The advanced routing features are there if I need them. I don't yet. And I'd rather have capabilities on the shelf than be forced into a migration when I actually need them.
The Honest Recommendation
If you're still on NGINX Ingress: migrate now. Not next quarter, not when you "have time." The retirement is here, and the migration is genuinely not that bad.
Here's what worked for me:
Deploy Envoy Gateway alongside your existing ingress. Don't rip and replace. Run both, migrate routes one at a time.
Start with your least critical service. Get comfortable with HTTPRoute syntax on something that won't page you.
Check your Helm charts. You might be surprised how many already support Gateway API resources. The migration might be a values file change, not a manifest rewrite.
Clean up after yourself. Once everything is migrated, remove the old ingress controller entirely. Don't leave it running "just in case." Dead configuration is how you end up with 124 devices on your network and no idea what half of them do.
The whole process took me about a week across three clusters, and most of that was methodical testing rather than actual problem-solving.
The Takeaway
I've written nearly 200 posts on this blog, and a surprising number of them are migration stories. Some were painful. Some were educational. Some were both. This one was neither — and that's the best possible outcome.
The goal of infrastructure isn't to be interesting. It's to be invisible. Envoy Gateway got out of the way and let me focus on the things that actually matter. Three months in, I have nothing to report. And sometimes, that's the best review I can give.
Work has been busy, but I found some time to update one of my open source tools, md-to-conf.
md-to-conf is a tool forked from RittmanMead that I continue to modify to push Markdown documentation into Confluence. It handles the boring parts of that workflow — converting fenced code blocks, uploading images as attachments, wiring up internal links — so the rest of the pipeline can stay out of it.
The 1.1.x releases focused on attachment handling and GitHub-flavored alert support. Version 1.2.0 ships something I’ve had on the backlog for a while: native Mermaid diagram rendering, with a fallback strategy that works out of the box in CI/CD pipelines that don’t have npm installed.
Here’s what changed.
What Was in 1.1.2
Before getting into the new stuff, a quick recap of where 1.1.2 left things:
– Attachment handling was overhauled to use Confluence’s REST API v2 endpoints consistently. The v1 attachment paths had been causing subtle issues, especially around upload confirmation and 404 handling.
– GitHub alert boxes landed in 1.1.0 — [!NOTE], [!TIP], [!IMPORTANT], [!WARNING], and [!CAUTION] now convert to proper Confluence info/tip/warning/note macros. The 1.1.1 and 1.1.2 cycle stabilized those, fixed a ReDoS vulnerability in the alert regex, and improved test coverage significantly.
– Folder ancestor support was added, so pages can be organized under a folder hierarchy when published.
– A handful of SonarQube issues were resolved — mostly type annotation hygiene and regex security flags.
Solid maintenance work. The goal for that cycle was making the tool reliably boring to operate, which is the right goal.
What’s New in 1.2.0
Mermaid Diagram Rendering
The headline feature: pass --mermaid and any fenced Mermaid code block in your Markdown gets rendered to a PNG and uploaded as an attachment before the page is published.
md-to-confarchitecture.mdMY_SPACE--mermaid
Your Markdown stays clean and human-readable:
```mermaidgraph TD A[Developer] -->|git push| B[CI Pipeline] B -->|md-to-conf| C[Confluence Page] C --> D[Team reads it] D -->|eventually| E[Documentation is current]```
And what lands in Confluence is an actual rendered diagram, not a gray code block that people have to squint at.
The Two-Strategy Rendering Pipeline
This is the design decision I spent the most time on. A lot of tools that promise Mermaid support require `mmdc` (the Mermaid CLI) to be on the PATH, which means coordinating an npm install in every environment that runs the tool. That’s fine for a developer workstation. It’s annoying for a CI agent, and it’s the first thing people hit when they try to use these features in automation.
md-to-conf 1.2.0 tries two strategies, in order:
Strategy 1: Local mmdc CLI
If mmdc is on the PATH, it renders the diagram locally. No network required. Fastest option, highest quality output.
npminstall-g@mermaid-js/mermaid-cli
Strategy 2: mermaid.ink public API
If mmdc isn’t found, the tool automatically falls back to mermaid.ink — a public rendering API that takes Base64-encoded diagram source and returns a PNG. It just needs outbound HTTPS access, which basically every pipeline already has.
No npm. No configuration. It works.
The fallback behavior is transparent — you don’t have to opt into it or configure anything. If mmdc is available, it’s used. If not, mermaid.ink picks it up silently. If both fail (offline environment, diagram syntax error), a warning is logged and the original code block is left intact. Nothing breaks.
For CI/CD pipelines, the practical implication is:
> --mermaid works out of the box with no additional tooling.
That’s the goal. You shouldn’t need to install anything extra just to get diagrams into your documentation.
Why This Matters
The reason I wanted this feature in the first place: architecture documentation that includes diagrams. The workflow without it was always one of:
1. Screenshot a diagram from some external tool, upload it manually, pray it stays current
2. Write the diagram in Mermaid, render it somewhere else, copy the image, upload it… manually
3. Just skip the diagram entirely (this one wins more often than it should)
Having --mermaid as a flag in the same command that handles the rest of the publish step closes that loop. The source of truth is the Markdown file, the rendered output is the Confluence page, and there’s nothing manual in between.
Upgrade Notes
The --mermaid flag is opt-in. Existing pipelines will continue to work without any changes. If you want diagram rendering, add the flag.
# Beforemd-to-confmy-doc.mdMY_SPACE# After, with Mermaid supportmd-to-confmy-doc.mdMY_SPACE--mermaid
If you want the local CLI for better quality or offline environments:
npminstall-g@mermaid-js/mermaid-cli
What I Learned
1. Two strategies beat one. The mmdc + mermaid.ink combination covers the two real environments this tool runs in: developer machines (mmdc likely available) and CI agents (probably not). Building the fallback in from day one avoids the “works on my machine” problem that would otherwise become a support issue.
2. Opt-in is the right default for new features. `–mermaid` doesn’t change existing behavior. I’ve learned to be conservative with flags — it’s much easier to add behavior behind a flag than to explain to people why their pipeline broke after an upgrade.
3. Fail gracefully and loudly. If a diagram can’t render, the code block stays intact and a warning is logged. The page publish doesn’t fail. That’s the right tradeoff — a partially rendered page is better than a broken pipeline, and the warning gives people something to act on.
4. Build on solid foundations. The mermaid images are written to a temp directory, uploaded as attachments, and wired into the page HTML. The 1.1.x attachment handling work — getting the v2 API paths right, fixing 404 handling — meant this feature had a clean surface to build on. That kind of maintenance investment pays off when you add something new.
The full changelog is in the repository. If you’re running md-to-conf and have Mermaid diagrams sitting unused in your Markdown files, give 1.2.0 a try and let me know how it goes.
After migrating my Proxmox hosts and the first Kubernetes cluster to their proper VLANs, I took a moment to appreciate my newly segmented network. Everything was isolated. Firewall policies were working. Life was good.
Then I looked at my network topology diagram and had a realization: my reverse proxy was in completely the wrong place.
The Current Setup
My reverse proxy (m5proxy, running nginx) handles all external HTTP/HTTPS traffic coming into my network. It’s the front door for everything—from my personal website to various services I self-host.
Its current location:
Physical location: Connected to ProCurve switch, Port 23
VLAN membership: VLAN 60 (Services)
Purpose: Reverse proxy to services on VLAN 50 (K8s) and VLAN 60 (other services)
Now, let’s trace the network path for an external request to a Kubernetes service on VLAN 50:
Count those hops: 6 total (3 switch hops, 3 routing decisions).
For every. Single. Request.
The Question
Why is my reverse proxy sitting behind the ProCurve switch when it’s handling traffic from the internet?
The UCG Max is my gateway. It’s where external traffic enters my network. So why was I routing that traffic to the ProCurve switch just to hit the reverse proxy, which then routes back through the switch to reach its destination?
Because I’d never questioned it. The ProCurve switch had available ports. The reverse proxy needed a port. Done.
The Better Way
The UCG Max has LAN ports. Physical ethernet ports that I can configure for specific VLANs.
What if I connected m5proxy directly to the UCG Max?
New network path:
Internet→UCGMax (m5proxy directlyconnected) → ProCurve switch (Ports13-16) → Kubernetes VM
Count those hops: 3 total (1 switch hop, 2 routing decisions).
50% reduction in network hops for every external request.
The Architecture Argument
Beyond the performance improvement, there’s an architectural argument: edge services belong at the network edge.
My reverse proxy is the entry point for all external traffic. It’s literally the edge of my internal network from an external perspective. So why was it sitting behind a switch, requiring traffic to traverse my internal infrastructure just to reach it?
It should be as close to the gateway as possible. Which means: directly connected to the UCG Max.
The Configuration
This turned out to be surprisingly straightforward:
Step 1: Configure a UCG Max LAN port for VLAN 60 (Services)
Via UniFi Controller → Port Management
Set port profile to VLAN 60
Configure as access port (not trunk—m5proxy only needs VLAN 60)
Step 2: Physical cable move
Unplug ethernet cable from ProCurve Port 23
Plug into configured UCG Max port
Wait for link to come up (~10 seconds)
Step 3: Verify connectivity
SSH to m5proxy: ssh root@m5proxy
Test gateway: ping 192.168.60.1 (UCG Max)
Test cross-VLAN: ping 192.168.50.x (K8s nodes)
Test external: ping 8.8.8.8
Step 4: Test reverse proxy functionality
From external network: curl -I https://mattgerega.com
Verify proxied requests work correctly
Check nginx logs for successful forwards
Total downtime: Maybe 2-3 minutes while the cable was being moved.
The Firewall Consideration
One thing to verify: m5proxy on VLAN 60 needs to be able to forward requests to services on VLAN 50 (K8s). That requires a firewall rule:
Services (VLAN 60) → Lab (VLAN 50): Allow
This rule should already exist if you’ve properly configured zone-based firewalls. But it’s worth double-checking before you move the proxy, because if that rule is missing, your external traffic will hit the proxy and then… nowhere.
Quick test from m5proxy before the move:
# Can the proxy reach K8s services?curl-Ihttp://192.168.50.x:port
If that works, the firewall rules are correct.
The Results
After the move:
External requests are noticeably snappier (hard to measure precisely, but the difference is perceivable)
Network topology is cleaner—edge service at the network edge
ProCurve Port 23 is now free for other devices
Traffic patterns make more logical sense
And the best part: everything still works. No broken services. No mysterious connectivity issues. Just cleaner architecture and better performance.
When NOT to Do This
Fair question: why doesn’t everyone do this?
Reason 1: If your reverse proxy needs to be on multiple VLANs, you’d need a trunk port on the UCG Max. That’s more complex than a simple access port configuration.
Reason 2: If your reverse proxy is a VM instead of a physical device, it makes sense for it to live wherever your hypervisor is. Don’t complicate your VM networking just to save a hop.
Reason 3: If your gateway has limited ports and they’re all in use, you don’t have a choice.
In my case: m5proxy is a physical device, it only needs VLAN 60 membership (forwarding to other VLANs happens via routing), and the UCG Max had available ports. Perfect use case.
What I Learned
Question your topology. Just because something works doesn’t mean it’s optimal. I’d been routing traffic through unnecessary hops for no good reason.
Edge services belong at the edge. If something handles external traffic, put it as close to your gateway as possible.
Port availability matters. Having available ports on your gateway opens up architectural options you might not have considered.
Testing is cheap, fixing is expensive. Spend 5 minutes verifying firewall rules and connectivity before you move cables, not after.
Physical changes are faster than you think. I spent more time planning this move than executing it. The actual cable swap took maybe 60 seconds.
After successfully migrating 44 wireless devices to proper VLANs, I felt pretty good about myself.
Wireless segmentation: ✅
Zone-based firewalls: ✅
Time to tackle the infrastructure, right? Well, Proxmox had other plans.
The Plan
I have two Proxmox hosts running my homelab:
pmxdell: A Dell laptop with one VM (Azure DevOps agent)
pxhp: An HP ProLiant with 17 VMs (three Kubernetes clusters)
The goal was simple:
Move Proxmox management interfaces to VLAN 60 (Services)
Move VMs to VLAN 50 (Lab)
Celebrate victory
The execution? Well, let’s just say I learned some things about Linux bridge VLANs that the documentation doesn’t emphasize enough.
Day 1: pmxdell and False Confidence
I started with pmxdell because it was the simpler host—just one VM to worry about. I configured a VLAN-aware bridge, added the management IP on VLAN 60, and restarted networking.
Everything worked. pmxdell came back up on 192.168.60.11. SSH worked. The Proxmox web interface was accessible. I was a networking wizard.
The VM started. It got… no IP address. DHCP requests disappeared into the void. The VM had no network connectivity whatsoever.
The Investigation
My first thought: firewall issue. But the firewall rules were correct—LAB zone could access WAN for DHCP.
Second thought: DHCP server problem. But other devices on VLAN 50 worked fine.
Third thought: Maybe I need to restart the VM differently? I stopped it, started it, rebooted it, sacrificed it to the networking gods. Nothing.
Then I ran bridge vlan show:
port vlan-idenp0s31f61PVIDEgressUntagged5060vmbr01PVIDEgressUntagged60
See the problem? VLAN 50 is on the physical interface (enp0s31f6), but not on the bridge device itself (vmbr0). The tap interface for the VM had nowhere to attach to.
The “bridge-vids” Revelation
My /etc/network/interfaces configuration looked like this:
I had assumed—like a reasonable person who reads documentation—that `bridge-vids 1 50 60` would add those VLANs to the entire bridge configuration.
Wrong.
bridge-vids only applies VLANs to the bridge ports (the physical interface). It doesn’t touch the bridge device itself. The bridge device needs VLANs added explicitly.
Why does this matter? Because when Proxmox creates a tap interface for a VM with a VLAN tag, it needs to add that tap interface as a member of that VLAN *on the bridge device*. If the bridge device doesn’t have that VLAN, the tap interface can’t join it.
VLAN 1 works automatically because it’s the default PVID on bridge devices. Any other VLAN? You have to add it manually.
The Fix
The solution was adding explicit post-up commands:
Applied the changes, stopped the VM, started it again (not restart—stop then start), and suddenly: DHCP lease acquired. VM online. Victory.
Day 2: pxhp and the Networking Service Trap
Armed with my new knowledge, I confidently configured pxhp. Four NICs bonded in LACP, VLAN-aware bridge, proper `post-up` commands. I even remembered to configure the bridge with VLAN 50 support from the start.
Then I made a critical mistake: I ran systemctl restart networking.
All 17 VMs instantly lost network connectivity.
Why Restarting Networking is Evil
When you run systemctl restart networking on a Proxmox host:
The bridge goes down
All tap interfaces are removed
All VMs lose their network connection
The bridge comes back up
The tap interfaces… don’t automatically recreate
Your VMs are now running but completely isolated from the network. You have to stop and start each VM to recreate its tap inte4rface.
The Better Approach: Shutdown VMs first, then restart networking. Or just reboot the entire host and let the VMs come back up automatically with proper tap interfaces.
I learned this the hard way when I had to stop and start 17 VMs manually. In the middle of the migration. With production workloads running.
Day 3: Kubernetes and the Blue-Green Migration
With both Proxmox hosts properly configured, it was time to migrate the Kubernetes clusters. I had three:
Non-production (3 VMs)
Internal (8 VMs)
Production (5 VMs)
The problem: Kubernetes nodes can’t easily change IP addresses. The IP is baked into etcd configuration, SSL certificates, and about seventeen other places. Changing IPs means major surgery with significant downtime risk.
The Solution: Blue-green deployment, Kubernetes-style.
Provision new nodes on VLAN 50
Join them to the existing cluster (now you have old + new nodes)
Drain workloads from old nodes to new nodes
Remove old nodes from the cluster
Delete old VMs
No IP changes. No etcd reconfiguration. No downtime. Just gradual migration while workloads stay running.
I started with the non-production cluster as a test. The entire migration took maybe 30 minutes, and the cluster never went offline. Workloads migrated seamlessly from old nodes to new nodes.
As of today, I’m 1 cluster down, 2 to go. The non-production cluster has been running happily on VLAN 50 for a few hours with zero issues.
What I Learned
bridge-vids is a lie. Or rather, it’s not a lie—it just doesn’t do what you think it does. It configures bridge ports, not the bridge device. Always add explicit post-up commands for VLAN membership.
Never restart networking on Proxmox with running VMs. Just don’t. Either shutdown VMs first, or reboot the whole host. Future you will thank past you.
Blue-green migrations work brilliantly for Kubernetes. Provision new nodes, migrate workloads, remove old nodes. No downtime, no drama.
Stop and start, never restart. When you change VM VLAN configuration, you need to stop the VM then start it. Restart doesn’t recreate the tap interface with new VLAN membership.
Test on simple hosts first. I started with pmxdell (1 VM) before tackling pxhp (17 VMs). That saved me from debugging VLAN issues with production workloads running.
The Current State
Infrastructure migration progress:
✅ Proxmox hosts: Both on VLAN 60 (Management)
✅ Kubernetes (non-prod): 3 VMs on VLAN 50
✅ Kubernetes (internal): 7 VMs on VLAN 50
✅ Kubernetes (production): 5 VMs on VLAN 50
Next steps: Monitor the clusters for 24-48 hours, then migrate internal cluster. Production cluster goes last because I’m not completely reckless.
You’re missing an agent…
The astute among you may notice that my internal cluster went from 8 nodes to 7. As I was cycling nodes, I took the time to check the resources on that cluster, and realized that some unrelated work to consolidate observability tools let me scale down to 4 agents. My clusters have started the year off right by losing a little weight.
A Story of SSID Consolidation and Zone-Based Security
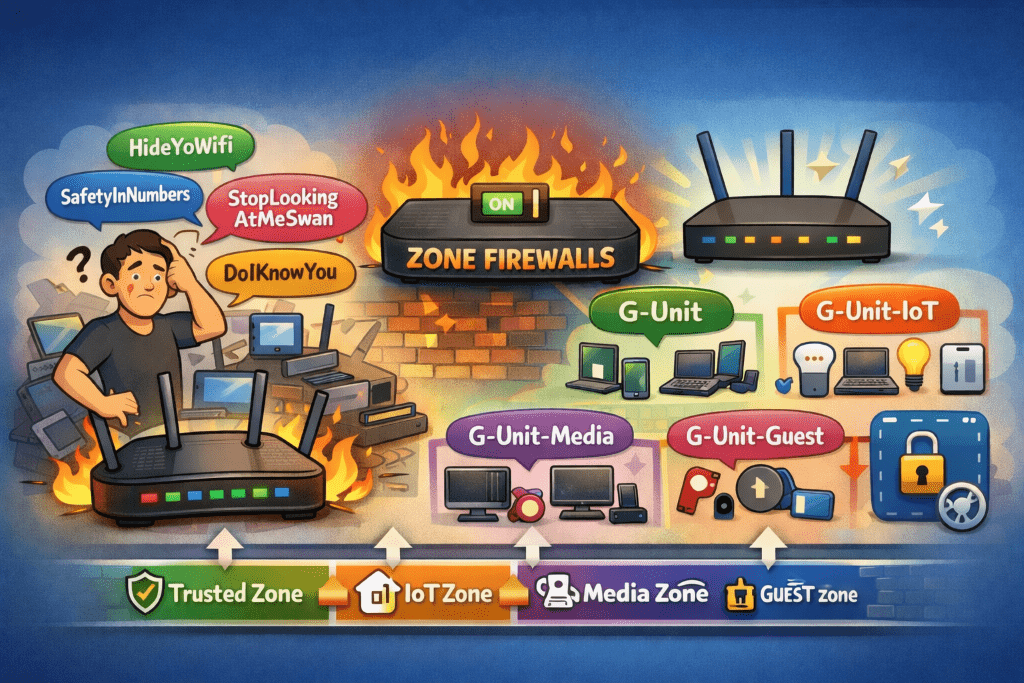
You know that moment when you’re explaining your home network to someone and you realize how ridiculous it sounds out loud? I had that moment when describing my SSID situation.
“So I have HideYoWifi, SafetyInNumbers, StopLookingAtMeSwan, and DoIKnowYou“
The look on their face said it all.
The SSID Situation
After cleaning up my device inventory (goodbye, 17 identical ubuntu-server instances), I turned my attention to the wireless side of things. I had four SSIDs, all serving the same flat VLAN 1 network. The only difference between them was… well, there wasn’t really a difference. They were functionally identical.
It was peak home network evolution: each SSID represented a moment in time when I thought “I’ll just create a new one for this use case” without ever deprecating the old ones.
The Upgrade That Changed Everything
My UCG Max supported zone-based firewalls, but I’d never enabled them. Why? Because zone-based firewalls are serious networking infrastructure, and I wasn’t sure I needed that level of complexity.
Then I looked at my flat network with its 77 devices and zero segmentation, and I realized: I absolutely needed that level of complexity.
On December 17th, I flipped the switch. The UCG Max upgraded to zone-based firewall mode, and suddenly I had the foundation for proper network segmentation. No more flat network. No more “everything can talk to everything” architecture. Just clean, policy-based isolation.
The SSID Consolidation
With zone-based firewalls enabled, having four identical SSIDs made even less sense. So I started the consolidation:
StopLookingAtMeSwan → Disabled (it had one device: a Blink connection module)
SafetyInNumbers → Merged into HideYoWifi (10 devices moved)
DoIKnowYou → Kept as guest network (zero devices, but useful for visitors)
HideYoWifi → Primary network (for now)
With my new VLAN architecture, I didn’t want a single “primary” network anymore. I wanted purpose-built SSIDs for different device classes. That meant new SSIDs with actual meaningful names.
Enter “G-Unit”
I needed a naming scheme. Something memorable, professional enough for guests, but with personality. I considered:
“HomeNet-X” (too boring)
“TheSkynet” (too obvious)
“NetworkNotFound” (too clever by half)
For obvious reasons, my family’s group chat name is “G-Unit.” Why not continue with that name?
And you know what? It actually *worked* as a naming scheme.
The New SSID Structure:
G-Unit → VLAN 10 (Trusted): Phones, laptops, work devices
G-Unit-IoT → VLAN 20 (IoT): Smart home devices, sensors, automation
G-Unit-Guest → VLAN 99 (Guest): Isolated network for visitors
Clean. Purposeful. Each SSID maps to a specific VLAN with specific firewall rules. No more “everything on VLAN 1” architecture.
The Migration
Between December 19th and 26th, I migrated 44 wireless devices across these new SSIDs. It was actually… smooth? Here’s why:
I kept the old SSIDs running during the migration. Devices could join the new SSIDs at their convenience. No forced cutover. No mass outage. Just gradual, steady progress.
The results:
December 19th: 24 of 41 devices migrated (59%)
December 19th evening: 36 of 41 devices migrated (88%)
December 26th: 44 of 44 devices migrated (100%)
That last device? An iPhone that had been forgotten on the old SSID. Once it reconnected to G-Unit, I disabled HideYoWifi for good.
The Zone-Based Firewall Magic
With devices properly segmented, I could finally implement the security policies I’d been planning:
IoT Zone (VLAN 20):
Can access Home Assistant (VLAN 60)
Can access internet
Cannot access file servers
Cannot access Proxmox infrastructure
Cannot access anything in Lab zone
Media Zone (VLAN 40):
Can access NAS for media streaming (VLAN 60)
Can access internet
Cannot access IoT devices
Cannot access infrastructure
Trusted Zone (VLAN 10):
Admin access to all zones (with logging)
Can manage infrastructure
Can access all services
It’s beautiful. My Chromecast can stream from my NAS, but it can’t SSH into my Proxmox hosts. My smart plugs can talk to Home Assistant, but they can’t access my file server. Security through actual network isolation, not just hoping nothing bad happens.
The Aftermath
As of December 26th:
– 100% of wireless devices migrated to zone-based VLANs
– Security score: 9.8/10 (up from 4/10 at the start)
The flat network is dead. Long live the segmented network.
What I Learned
SSID consolidation is easier than you think. Keep old SSIDs running during migration. Let devices move at their own pace.
Zone-based firewalls change everything. Once you have proper segmentation, you can actually enforce security policies instead of just hoping for the best.
Naming matters. “G-Unit” is objectively ridiculous, but it’s memorable and tells a story. Sometimes that’s more important than being “professional.”
Patience pays off. I could have forced a cutover in one evening. Instead, I spent a week doing gradual migration, and I had zero issues.
Next up: The infrastructure migration. Proxmox hosts, Kubernetes clusters, and the moment I discovered that bridge-vids doesn’t do what I thought it did.
Discovering 124 devices in my “simple” home network
I thought I knew my home network. I had a router, some switches, a few VLANs that made sense at the time, and everything just… worked. Until the day I decided to actually document what I had.
Turns out, I didn’t know my network at all.
The Discovery
I fired up the UniFi controller expecting to see maybe 40-50 devices. You know, the usual suspects: phones, laptops, smart home devices, maybe a few Raspberry Pis. The controller reported 124 active devices.
*One hundred and twenty-four.*
I immediately had questions. Important questions like “what the hell is ubuntu-server-17?” and “why do I have *seventeen* devices all named ubuntu-server?”
The Forensics Begin
Armed with an AI agent and a growing sense of dread, I started the archaeological dig. The results were… enlightening:
The Good:
5 security cameras actually recording to my NAS
A functioning Kubernetes cluster (three of them, actually)
Two Proxmox hosts quietly doing their job
The Bad:
17 identical ubuntu-server instances (spoiler: they were old SQL Server experiments)
Devices with names like Unknown-b0:8b:a8:40:16:b6 (which turned out to be my Levoit air purifier)
Four SSIDs serving the same flat network because… reasons?
The Ugly:
Everything on VLAN 1
No segmentation whatsoever
My security cameras had full access to my file server
My IoT devices could theoretically SSH into my Proxmox hosts
The Uncomfortable Truths
I had built this network over years, making pragmatic decisions that made sense *at the time*. Need another VM? Spin it up on VLAN 1. New smart device? Connect it to the existing SSID. Another Raspberry Pi project? You guessed it—VLAN 1.
The result was a flat network that looked like a child had organized my sock drawer: functional, but deeply concerning to anyone who knew what they were looking at.
The Breaking Point
Two things finally pushed me to action:
1. The Device Census: After identifying and cleaning up the obvious cruft, I still had 77 active devices with zero network segmentation.
2. The “What If” Scenario: What if one of my IoT devices got compromised? It would have unfettered access to everything. My NAS. My Proxmox hosts. My Kubernetes clusters. Everything.
I couldn’t just clean up the device list and call it done. I needed actual network segmentation. Zone-based firewalls. The works.
Second: VLAN infrastructure and zone-based firewall policies
Third: Device-by-device migration with minimal disruption
Fourth: The scary part—migrating my Kubernetes clusters without breaking everything
I’ll be documenting the journey here, including the inevitable mistakes, late-night troubleshooting sessions, and that special moment when you realize you’ve locked yourself out of your own network.
Because if there’s one thing I’ve learned from this experience, it’s that home networks are never as simple as you think they are.
This is Part 1 of a series on rebuilding my home network from the ground up. Next up: Why “G-Unit” became my SSID naming scheme, and how zone-based firewalls changed everything.
Running multiple Kubernetes clusters is great until you realize your telemetry traffic is taking an unnecessarily complicated path. Each cluster had its own Grafana Alloy instance dutifully collecting metrics, logs, and traces—and each one was routing through an internal Nginx reverse proxy to reach the centralized observability platform (Loki, Mimir, and Tempo) running in my internal cluster.
This worked, but it had that distinct smell of “technically functional” rather than “actually good.” Traffic was staying on the internal network (thanks to a shortcut DNS entry that bypassed Cloudflare), but why route through an Nginx proxy when the clusters could talk directly to each other? Why maintain those external service URLs when all my clusters are part of the same infrastructure?
Linkerd multi-cluster seemed like the obvious answer for establishing direct cluster-to-cluster connections, but the documentation leaves a lot unsaid when you’re dealing with on-premises clusters without fancy load balancers. Here’s how I made it work.
The Problem: Telemetry Taking the Scenic Route
My setup looked like this:
– Internal cluster: Running Loki, Mimir, and Tempo behind an Nginx gateway
– Production cluster: Grafana Alloy sending telemetry to loki.mattgerega.net, mimir.mattgerega.net, etc.
– Nonproduction cluster: Same deal, different tenant ID
Every metric, log line, and trace span was leaving the cluster, hitting the Nginx reverse proxy, and finally making it to the monitoring services—which were running in a cluster on the same physical network. The inefficiency was bothering me more than it probably should have.
This meant:
– An unnecessary hop through the Nginx proxy layer
– Extra TLS handshakes that didn’t add security value between internal services
– DNS resolution for external service names when direct cluster DNS would suffice
– One more component in the path that could cause issues
The Solution: Hub-and-Spoke with Linkerd Multi-Cluster
Linkerd’s multi-cluster feature does exactly what I needed: it mirrors services from one cluster into another, making them accessible as if they were local. The service mesh handles all the mTLS authentication, routing, and connection management behind the scenes. From the application’s perspective, you’re just calling a local Kubernetes service.
For my setup, a hub-and-spoke topology made the most sense. The internal cluster acts as the hub—it runs the Linkerd gateway and hosts the actual observability services (Loki, Mimir, and Tempo). The production and nonproduction clusters are spokes—they link to the internal cluster and get mirror services that proxy requests back through the gateway.
The beauty of this approach is that only the hub needs to run a gateway. The spoke clusters just run the service mirror controller, which watches for exported services in the hub and automatically creates corresponding proxy services locally. No complex mesh federation, no VPN tunnels, just straightforward service-to-service communication over mTLS.
Gateway Mode vs. Flat Network
(Spoiler: Gateway Mode Won)
Linkerd offers two approaches for multi-cluster communication:
Flat Network Mode: Assumes pod networks are directly routable between clusters. Great if you have that. I don’t. My three clusters each have their own pod CIDR ranges with no interconnect.
Gateway Mode: Routes cross-cluster traffic through a gateway pod that handles the network translation. This is what I needed, but it comes with some quirks when you’re running on-premises without a cloud load balancer.
The documentation assumes you’ll use a LoadBalancer service type, which automatically provisions an external IP. On-premises? Not so much. I went with NodePort instead, exposing the gateway on port 30143.
The Configuration: Getting the Helm Values Right
Here’s what the internal cluster’s Linkerd multi-cluster configuration looks like:
linkerd-multicluster:gateway:enabled: trueport: 4143serviceType: NodePortnodePort: 30143probe:port: 4191nodePort: 30191# Grant access to service accounts from other clustersremoteMirrorServiceAccountName: linkerd-service-mirror-remote-access-production,linkerd-service-mirror-remote-access-nonproduction
And for the production/nonproduction clusters:
linkerd-multicluster:gateway:enabled: false# No gateway needed hereremoteMirrorServiceAccountName: linkerd-service-mirror-remote-access-in-cluster-local
The Link: Connecting Clusters Without Auto-Discovery
Creating the cluster link was where things got interesting. The standard command assumes you want auto-discovery:
Separating --gateway-addresses and --gateway-port made all the difference.
I used DNS (tfx-internal.gerega.net) instead of hard-coded IPs for the gateway address. This is an internal DNS entry that round-robins across all agent node IPs in the internal cluster. The key advantage: when I cycle nodes (stand up new ones and destroy old ones), the DNS entry is maintained automatically. No manual updates to cluster links, no stale IP addresses, no coordination headaches—the round-robin DNS just picks up the new node IPs and drops the old ones.
Service Export: Making Services Visible Across Clusters
Linkerd doesn’t automatically mirror every service. You have to explicitly mark which services should be exported using the mirror.linkerd.io/exported: "true" label.
For the Loki gateway (and similarly for Mimir and Tempo):
The final piece was updating Grafana Alloy’s configuration to use the mirrored services instead of the external URLs. Here’s the before and after for Loki:
No more TLS, no more public DNS, no more reverse proxy hops. Just a direct connection through the Linkerd gateway.
But wait—there’s one more step.
The Linkerd Injection Gotcha
Grafana Alloy pods need to be part of the Linkerd mesh to communicate with the mirrored services. Without the Linkerd proxy sidecar, the pods can’t authenticate with the gateway’s mTLS requirements.
This turned into a minor debugging adventure because I initially placed the `podAnnotations` at the wrong level in the Helm values. The Grafana Alloy chart is a wrapper around the official chart, which means the structure is:
alloy:controller: # Not alloy.alloy!podAnnotations:linkerd.io/inject: enabledalloy:# ... other config
Once that was fixed and the pods restarted, they came up with 3 containers instead of 2:
– `linkerd-proxy` (the magic sauce)
– `alloy` (the telemetry collector)
– `config-reloader` (for hot config reloads)
Checking the gateway logs confirmed traffic was flowing:
There’s one quirk worth mentioning: the multi-cluster probe health checks don’t work in NodePort mode. The service mirror controller tries to check the gateway’s health endpoint and reports it as unreachable, even though service mirroring works perfectly.
From what I can tell, this is because the health check endpoint expects to be accessed through the gateway service, but NodePort doesn’t provide the same service mesh integration as a LoadBalancer. The practical impact? None. Services mirror correctly, traffic routes successfully, mTLS works. The probe check just complains in the logs.
What I Learned
1. Gateway mode is essential for non-routable pod networks. If your clusters don’t have a CNI that supports cross-cluster routing, gateway mode is the way to go.
2. NodePort works fine for on-premises gateways. You don’t need a LoadBalancer if you’re willing to manage DNS.
3. DNS beats hard-coded IPs. Using `tfx-internal.gerega.net` means I can recreate nodes without updating cluster links.
4. Service injection is non-negotiable. Pods must be part of the Linkerd mesh to access mirrored services. No injection, no mTLS, no connection.
5. Helm values hierarchies are tricky. Always check the chart templates when podAnnotations aren’t applying. Wrapper charts add extra nesting.
The Result
Telemetry now flows directly from production and nonproduction clusters to the internal observability stack through Linkerd’s multi-cluster gateway—all authenticated via mTLS, bypassing the Nginx reverse proxy entirely.
I didn’t reduce the number of monitoring stacks (each cluster still runs Grafana Alloy for collection), but I simplified the routing by using direct cluster-to-cluster connections instead of going through the Nginx proxy layer. No more proxy hops. No more external service DNS. Just three Kubernetes clusters talking to each other the way they should have been all along.
The full configuration is in the ops-argo and ops-internal-cluster repositories, managed via ArgoCD ApplicationSets. Because if there’s one thing I’ve learned, it’s that GitOps beats manual kubectl every single time.
Sometimes migrations aren’t about chasing the newest technology—they’re about abandoning ship before it sinks. In December 2025, MinIO officially entered “maintenance mode” for its open-source edition, effectively ending active development. Combined with earlier moves like removing the admin UI, discontinuing Docker images, and pushing users toward their $96,000+ AIStor paid product, the writing was on the wall: MinIO’s open-source days were over.
Time to find a replacement.
Why I Had to Leave MinIO
Let’s be clear: MinIO used to be excellent open-source software. Past tense. Over the course of 2025, the company systematically dismantled what made it valuable for home lab and small-scale deployments:
June 2025: Removed the web admin console from the Community Edition. Features like bucket configuration, lifecycle policies, and account management became CLI-only—or you could pay for AIStor.
The pattern was obvious: push users toward AIStor, a proprietary product starting at nearly $100k, by making the open-source version progressively less usable. The community called it what it was—a lock-in strategy disguised as “streamlining.”
I’m not paying six figures for object storage in my home lab. Time to migrate.
Enter Garage
I needed S3-compatible storage that was:
Actually open source, not “open source until we change our minds”
Lightweight, suitable for single-node deployments
Actively maintained by a community that won’t pull the rug out
Garage checked all the boxes. Built in Rust by the Deuxfleurs collective, it’s designed for geo-distributed deployments but scales down beautifully to single-node setups. More importantly, it’s genuinely open source—developed by a collective, not a company with a paid product to upsell.
The Migration Process
Vault: The Critical Path
Vault was the highest-stakes piece of this migration. It’s the backbone of my secrets management, and getting this wrong meant potentially losing access to everything. I followed the proper migration path:
Stopped the Vault pod in my Kubernetes cluster—no live migrations, no shortcuts
Used vault operator migrate to transfer the storage backend from MinIO to Garage—this is the officially supported method that ensures data integrity
Updated the vault-storage-config Kubernetes secret to point at the new Garage endpoint
Restarted Vault and unsealed it with my existing keys
The vault operator migrate command handled the heavy lifting, ensuring every key-value pair transferred correctly. While I could have theoretically just mirrored S3 buckets and updated configs, using the official migration tool gave me confidence nothing would break in subtle ways later.
Monitoring Stack: Configuration Updates
With Vault successfully migrated, the rest was straightforward. I updated S3 endpoint configurations across my monitoring stack in ops-internal-cluster:
Loki, Mimir, and Tempo all had their storage backends updated:
Old: cloud.gerega.net:39000 (MinIO)
New: cloud.gerega.net:3900 (Garage)
I intentionally didn’t migrate historical metrics and logs. This is a lab environment—losing a few weeks of time-series data just means starting fresh with cleaner retention policies. In production, you’d migrate this data. Here? Not worth the effort.
Monitoring Garage Itself
I added a Grafana Alloy scrape job to collect Garage’s Prometheus metrics from its /metrics endpoint. No blind spots from day one—if Garage has issues, I’ll know immediately.
Deployment Architecture
One deliberate choice: Garage runs as a single Docker container on bare metal, not in Kubernetes. Object storage is foundational infrastructure. If my Kubernetes clusters have problems, I don’t want my storage backend tied to that failure domain.
Running Garage outside the cluster means:
Vault stores data independently of cluster state
Monitoring storage (Loki, Mimir, Tempo) persists during cluster maintenance
One less workload competing for cluster resources
Verification and Cleanup
Before decommissioning MinIO, I verified nothing was still pointing at the old endpoints:
# Searched across GitOps repos
grep -r "39000" .        # Old MinIO port
grep -r "192.168.1.30" . # Old MinIO IP
grep -r "s3.mattgerega.net" .
Clean sweep—everything migrated successfully.
Current Status
Garage has been running for about a week now. Resource usage is lower than MinIO ever was, and everything works:
Vault sealed/unsealed multiple times without issues
Loki ingesting logs from multiple clusters
Mimir storing metrics from Grafana Alloy
Tempo collecting distributed traces
The old MinIO instance is still running but idle. I’ll give it another week before decommissioning entirely—old habits die hard, and having a fallback during initial burn-in feels prudent.
Port 3900 is the new standard. Port 39000 is legacy. And my infrastructure is no longer dependent on a company actively sabotaging its open-source product.
Lessons for the Homelab Community
If you’re still running MinIO Community Edition, now’s the time to plan your exit strategy. The maintenance-mode announcement wasn’t a surprise—it was the inevitable conclusion of a year-long strategy to push users toward paid products.
Alternatives worth considering:
Garage: What I chose. Lightweight, Rust-based, genuinely open source.
SeaweedFS: Go-based, active development, designed for large-scale deployments but works at small scale.
Ceph RGW: If you’re already running Ceph, the RADOS Gateway provides S3 compatibility.
The MinIO I deployed years ago was a solid piece of open-source infrastructure. The MinIO of 2025 is a bait-and-switch. Learn from my migration—don’t wait until you’re forced to scramble.
Technical Details:
Garage deployment: Single Docker container on bare metal
As with any good engineer, I cannot leave well enough alone. Over the past week, I’ve been working through a significant infrastructure modernization across my home lab clusters – migrating from NGINX Ingress to Envoy Gateway and implementing the Kubernetes Gateway API. This also involved some necessary housekeeping with chart updates and a shift to Server-Side Apply for all ArgoCD-managed resources.
Why Change?
The timing couldn’t have been better. In November 2024, the Kubernetes SIG Network and Security Response Committee announced that Ingress NGINX will be retired in March 2026. The project has struggled with insufficient maintainer support, security concerns around configuration snippets, and accumulated technical debt. After March 2026, there will be no further releases, security patches, or bug fixes.
The announcement strongly recommends migrating to the Gateway API, described as “the modern replacement for Ingress.” This validated what I’d already been considering – the Gateway API provides a more standardized, vendor-neutral approach with better separation of concerns between infrastructure operators and application developers.
Envoy Gateway, being a CNCF project built on the battle-tested Envoy proxy, seemed like a natural choice for this migration. Plus, it gave me an excuse to finally move off Traefik, which was… well, let’s just say it was time for a change.
The Migration Journey
The migration happened in phases across my ops-argo, ops-prod-cluster, and ops-nonprod-cluster repositories. Here’s what changed:
Phase 1: Adding Envoy Gateway
I started by adding Envoy Gateway as a cluster tool, complete with its own ApplicationSet that deploys to clusters labeled with spydersoft.io/envoy-gateway: "true". The deployment includes:
GatewayClass and Gateway resources: Defined a main gateway that handles traffic routing
EnvoyProxy configuration: Set up with a static NodePort service for consistent external access
ClientTrafficPolicy: Configured to properly handle forwarded headers – crucial for preserving client IP information through the proxy chain
The Envoy Gateway deployment lives in the envoy-gateway-system namespace and exposes services via NodePort 30080 and 30443, making it easy to integrate with my existing network setup.
Phase 2: Migrating Applications to HTTPRoute
This was the bulk of the work. Each application needed its Ingress resource replaced with an HTTPRoute. The new Gateway API resources are much cleaner. For example, my blog (www.mattgerega.com) went from an Ingress definition to this:
This is a better practice for ArgoCD as it allows Kubernetes to handle three-way merge patches instead of client-side strategic merge, reducing conflicts and improving sync reliability.
Lessons Learned
Gateway API is ready for production: The migration was surprisingly smooth. The Gateway API resources are well-documented and intuitive. With NGINX Ingress being retired, now’s the time to make the jump.
HTTPRoute vs. Ingress: HTTPRoute is more expressive and allows for more sophisticated routing rules. The explicit parentRefs concept makes it clear which gateway handles which routes.
Server-Side Apply everywhere: Should have done this sooner. The improved conflict handling makes ArgoCD much more reliable, especially when multiple controllers touch the same resources.
Envoy’s configurability: The EnvoyProxy custom resource gives incredible control over the proxy configuration without needing to edit ConfigMaps or deal with annotations.
Multi-cluster consistency: Making these changes across production and non-production environments simultaneously kept everything aligned and reduced cognitive overhead when switching between environments.
Current Status
All applications across all clusters are now running through Envoy Gateway with the Gateway API. Traffic is flowing correctly, TLS is terminating properly, and I’ve removed all the old ingress-related configuration from both production and non-production environments.
The clusters are more standardized, the configuration is cleaner, and I’m positioned to take advantage of future Gateway API features like traffic splitting and more advanced routing capabilities. More importantly, I’m ahead of the March 2026 retirement deadline with plenty of time to spare.
Now, the real question: what am I going to tinker with next?
Over the past few weeks, I’ve been on both a physical and digital cleaning spree. It was long overdue, and honestly, it feels like a weight has been lifted from my shoulders.
Winterizing everything
Technically, fall just started a week ago. But in the Northeast, “fall” can mean anything from 80-degree afternoons to an early snowstorm. With school and sports in full swing, the pool had seen its last swim of the season, which meant it was time to close things up. Along with that came the annual migration of tropical plants into the house for the winter.
Before I could even get there, though, my storage shed and garage were in desperate need of a purge. Ten contractor bags later, I finally had the space to neatly store the things that actually matter.
With that newfound space came the itch to reorganize. I moved a few items from the garage to the shed, built out some shelves and lofts, and—of course—came up with a dozen new project ideas, like adding a ramp to the shed. Luckily, I reined in the scope creep and wrapped things up neatly for winter.
Digital Destruction
On the digital front, I’d been putting off a project for a while: decommissioning my local Active Directory domain. The only reason I had one in the first place was to make managing Windows servers easier. But as I’ve shifted to Proxmox and Kubernetes clusters, the need for Active Directory dropped off pretty quickly.
Most of my DNS had already moved to my Unifi Gateway. The only holdup was that a few personal machines were still joined to the domain, meaning I had to migrate user profiles. Not difficult—just tedious.
In full cleanup mode, I finally bit the bullet. After an hour or so per machine, everything was running on local profiles, disconnected from the domain. With that, I shut down the AD servers and haven’t looked back.
Streamlining
I’m happy with where things landed. While I don’t have a centralized user directory anymore, I’ve gained flexibility—and peace of mind. My AD domain was running on “lab-grade” hardware, so losing it would’ve been a headache. Now, I don’t have to worry.
Nearly everything powering my home automation has already been moved off the lab gear, except for a single NodeRed instance. I haven’t decided where to run it yet, but it’ll be migrated soon.
With this cleanup, I’ve officially decommissioned my last two Windows servers—the domain controllers. My home lab is now fully containerized, and my garage and shed are finally ready for winter.
In short: a fall purge on both fronts—physical and digital—left me with more space, less clutter, and a lot more breathing room.